Linearly separable models
The McCulloch-Pitts 1943 neuron (see Chapter 2, Think Like a Machine) lead to Rosenblatt's 1957-1962 perceptron and the 1960 Widrow-Hoff adaptive linear element (Adaline).
These models are linear models based on f(x,w), requiring a line to separate results. A perceptron cannot achieve this goal and thus cannot classify many objects it faces.
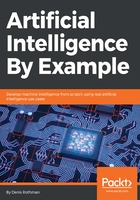
A standard linear function can separate values. Linear separability can be represented in the following graph:

Imagine that the line separating the preceding dots and the part under it represent a picture that needs to be represented by a machine learning or deep learning application. The dots above the line represent clouds in the sky; the dots below the line represent trees on a hill. The line represents the slope of that hill.
To be linearly separable, a function must be able to separate the clouds from the trees to classify them. The prerequisite to classification is separability of some sort, linear or nonlinear.